In a typical business intelligence solution, you need all sorts of reports. PerformancePoint Services excels in the creation of KPIs and scorecards.
If you need other type of reports (tabular, interactive, visual, or
freeform), you’ll need SQL Server Reporting Services. SQL Server
Reporting Services is a server-based report generation platform that
provides the means to create, deploy, and manage reports, and it is a
reporting platform that integrates well with SharePoint. The integration
of SQL Server Reporting Services with SharePoint includes the following
features.
In addition to offering
ready-to-use reports, SQL Server Reporting Services 2008 allows end
users to create specific reports that are based on predefined models. It
also allows you to export reports manually to other formats such as
Excel. SQL Server Reporting Services 2008 is released as a part of SQL
Server Express, Workgroup, Standard, and Enterprise editions, so you
don’t need to purchase a separate license to start using it.
1. What’s New in SQL Server Reporting Services 2008
SQL Server Reporting Services 2008 has introduced a significant amount of new features in the following key areas.
Note:
There have also been
interesting innovations regarding report programmability, such as the
ability to preprocess report definitions and support for data-driven
subscriptions and job management for situations in which SQL Server
Reporting Services 2008 is deployed in SharePoint integrated mode.
1.1. Report Authoring
SQL Server Reporting Services
2008 has always enabled you to create reports that consume data coming
from many types of data sources. Newly added in SQL Server Reporting
Services 2008 is the ability for reports to consume data from Teradata
databases (databases that use Teradata relational database software and
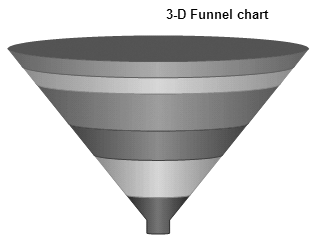
are specifically designed for data warehousing). There have been vast
additions to the collection of data visualization features in the form
of a new chart data region that can include bar/column cylinders,
pyramids, funnels, polars, radars, stocks, candlesticks, range bars,
smooth areas, smooth lines, stepped lines, box plot charts, Pareto
charts, and histograms. An example of a funnel chart created with SQL
Server Reporting Services 2008 is shown in Figure 1.
Also, there is a new
gauge data region that displays one or more gauges (such as a
thermometer gauge). An example of a gauge data region is shown in Figure 2.

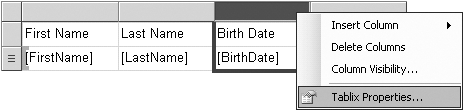
The tablix data region is a major enhancement that improves report
flexibility; it replaces the old table, matrix, and list data regions. A
tablix data region is a flexible grid layout that supports multiple row
and column groups and allows the display of subtotals, totals, and
grand totals. A cell within a tablix data region can contain any other
report item, such as another data region. This allows you to combine
table, matrix, and list structures and create complex reports that
integrate traits of various report types. An example of a tablix data
region is shown in Figure 3.
Another long-awaited
feature is added support for text and HTML. In SQL Server Reporting
Services 2008, the text box report item allows you to apply various
style elements, and you now can import basic HTML from a field in your
application database for safe display in the report.
There have also been
improvements in the Report Designer, a tool that integrates with Visual
Studio.NET, but because that is a developer-oriented topic. You can visit http://www.microsoft.com/sqlserver/2008/en/us/reporting.aspx
for more information. SQL Server Reporting Services 2008 includes
another tool that is used to create reports, a tool that will be used
primarily by end users. It is called Report Builder 2.0, and it contains
new features like enhanced data layout, visualization, text formatting,
and on-demand rendering in an Office-like authoring environment.
Finally, new report elements
have been added that provide more control over the way page headers,
footers, sections, margins, columns, column spacing, and pagination are
handled and rendered.
1.2. Report Processing and Rendering
Report processing and
rendering have undergone some important changes too. Most importantly,
SQL Server Reporting Services 2008 now allows you to export a report to a
Microsoft Word document (Word 2000 or later), which is possible through
the addition of a Word rendering extension. It also includes
enhancements for the already existing Microsoft Excel rendering
extension in the form of support for rendering subreports and nested
data regions. The CSV data-rendering extension is improved by removing
layout information from the output. This is a step forward, because
data-only content is much easier for other applications to process. The
rendering model now supports on-demand report processing that renders
each page of a report as you view it. With this feature, support for
viewing large amounts of data in SQL Server Reporting Services 2008
reports has improved dramatically and also provides an improved
first-page response time.
1.3. Architecture and Tool Changes
The SQL Server
Reporting Services 2008 architecture has been redesigned thoroughly,
which has made it more scalable and easier to manage. The most
significant change is that in SQL Server Reporting Services 2008, it is
possible to run the report server as a true middle-tier application that
doesn’t have to be hosted on a Web front-end server; you can host it on
a dedicated application server. In the section titled Section 2
later in this article, you can take a close look at the architecture of
SQL Server Reporting Services 2008 in SharePoint integrated mode.
The tools that you need to
manage SQL Server Reporting Services 2008 in SharePoint integrated mode
have undergone changes so that their functionality no longer overlaps.
The set of tools itself hasn’t changed and consists of the following
items.
Reporting Services Configuration
Used to configure and manage a report server installation. Use this
tool to set service accounts, create or manage report server databases,
configure URLs, set the unattended execution account, configure report
server e-mail settings, and manage encryption keys, if you choose to use
them.
SQL Server Management Studio
Used to manage database server properties, create shared schedules,
configure role definitions and view permission levels, and manage
scheduled jobs that are currently in progress on the report server. The
most important thing this tool doesn’t do is manage permissions, because
all content management needs to be done through the normal SharePoint
interface.
Reporting Services Add-in for SharePoint
Used to specify all sorts of settings such as integrating new report
servers with SharePoint, specifying the authentication mode used by the
SharePoint site or farm, specifying report processing time-outs,
enabling logging, and enabling customized report building using the
Report Builder tool.
Ultimately, the biggest
enhancement to the Reporting Services toolset has been the addition of
support for SharePoint 2010. The next section, Section 21.3.2, discusses the architecture of SQL Server Reporting Services 2008 in more detail.